A. Oltmann, R. Kusche and P. Rostalski, DGBMT Annual Conference on Biomedical Engineering, Hannover, 2021 / Current Directions in Biomedical Engineering, 7, 2, 2021; DOI: 10.1515/cdbme-2021-2039; [PDF]
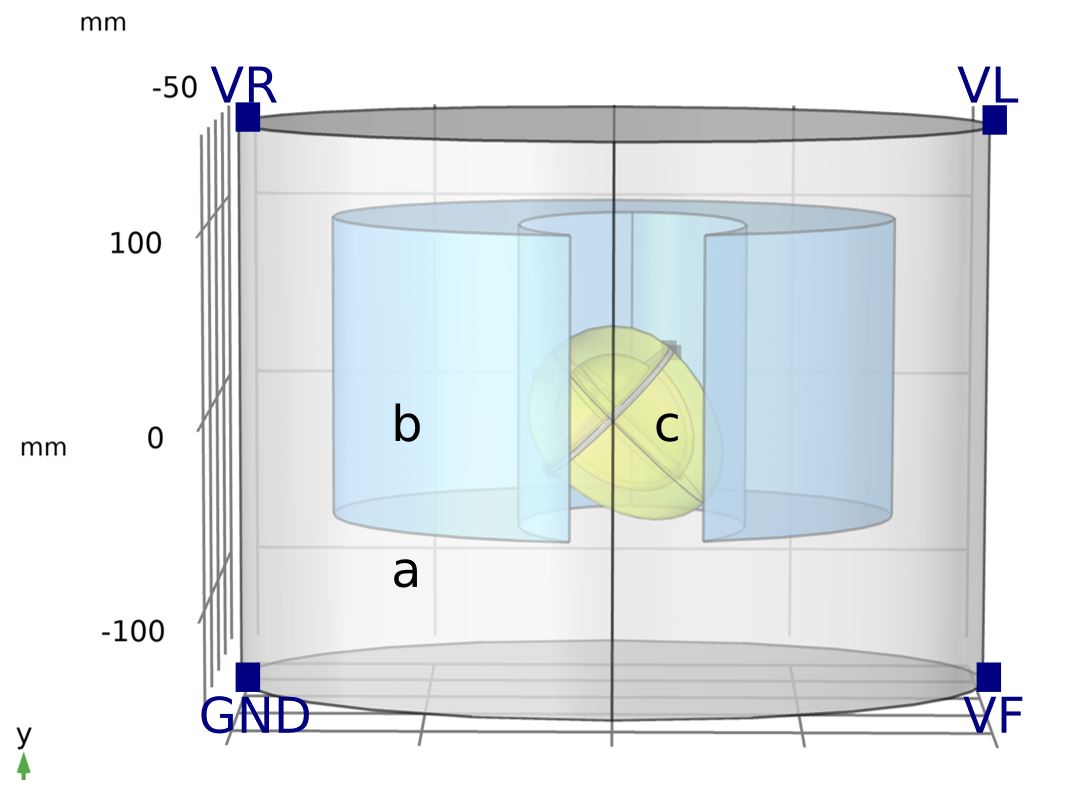
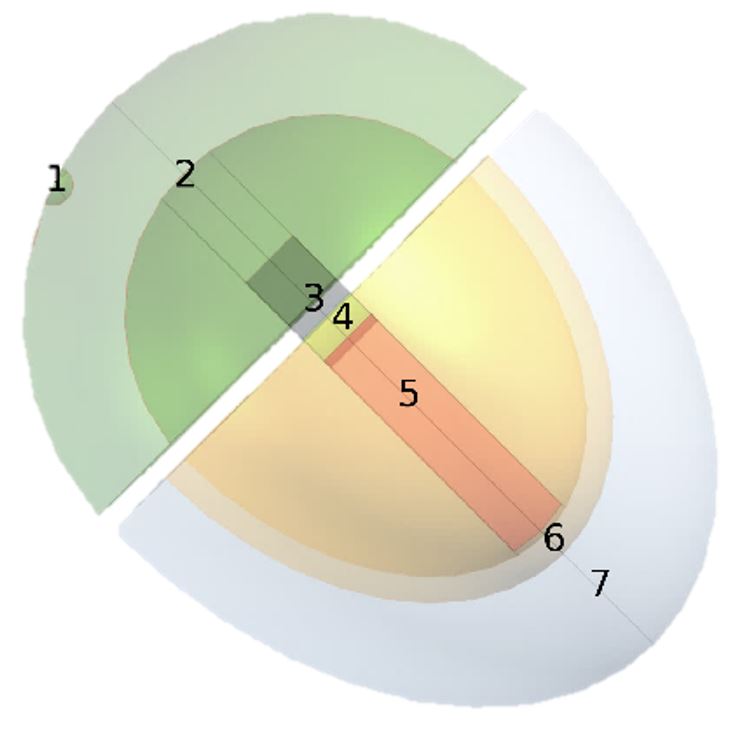
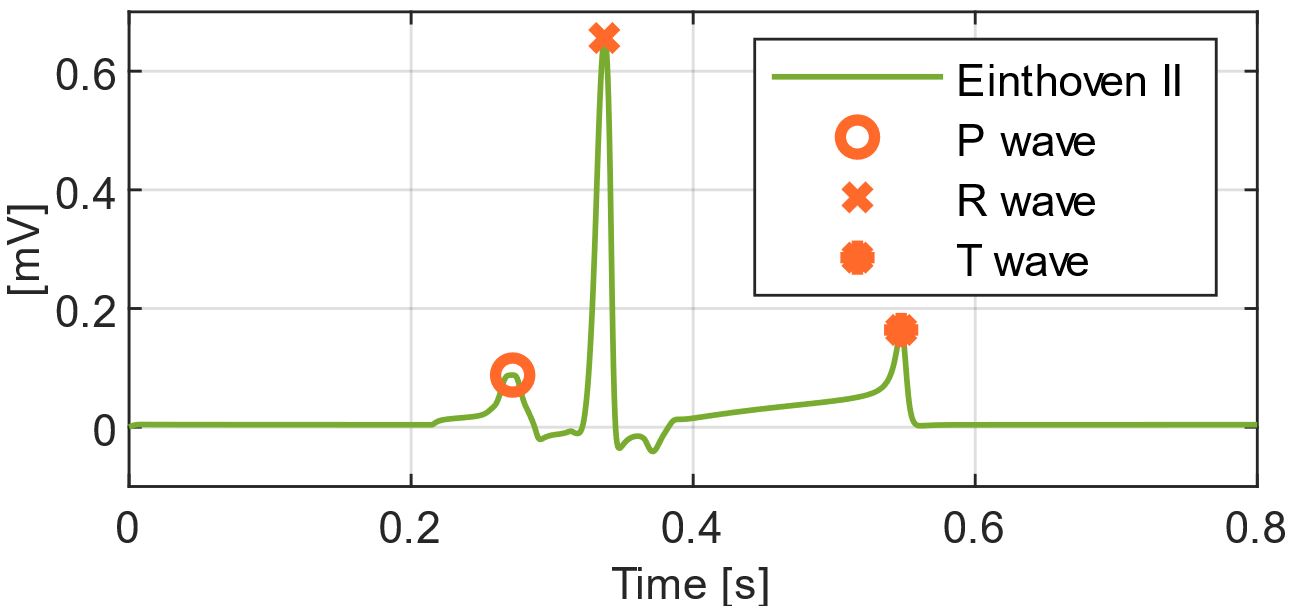
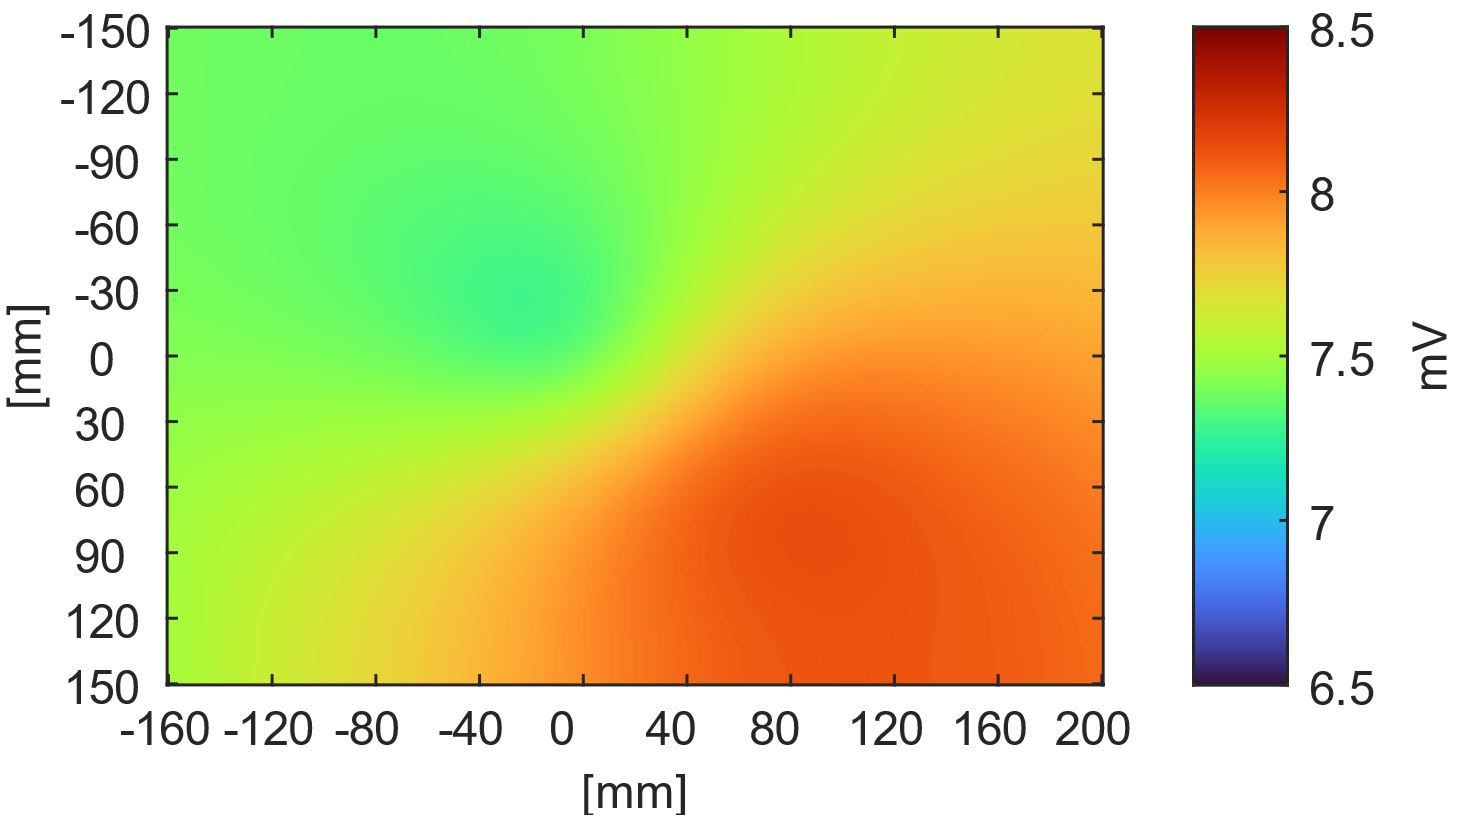
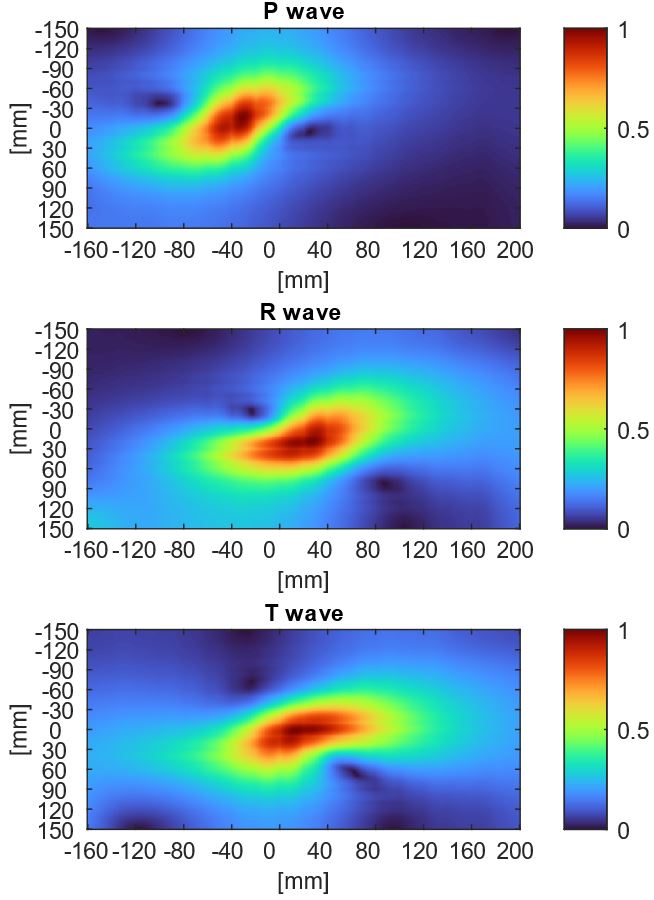
Abstract: The electrocardiogram (ECG) is a well-known technique used to diagnose cardiac diseases. To acquire the spatial signal characteristics from the thorax, multiple electrodes are commonly used. Displacements of electrodes affect the signal morphologies and can lead to incorrect diagnoses. For quantitative analysis of these effects we propose the usage of a numerical computer simulation. In order to create a realistic representation of the human thorax including the heart and lung a three-dimensional model with a simplified geometry is used. The electrical excitation of the heart is modelled on a cellular level via the bidomain approach. To numerically solve the differential equations, describing the signal propagation within the body, we use the finite element method in COMSOL Multiphysics. The spatial gradients of the simulated body potentials are calculated to determine placement sensitivity maps. The simulated results show that the sensitivity is different for each considered point in time of each ECG wave. In general, the impact of displacement is increased as an electrode is more closely located to the signal source. However, in some specific regions associated with differential ECG leads the placement sensitivity distribution deviates from this simple circular pattern. The results provide useful information to enhance the understanding of placed specific effects on classical ECG features. By additional consideration of patient-specific characteristics in the future, the used model has the ability to investigate additional body-related aspects such as geometrical body shape or composition of various tissue types.