R. Kusche, and M. Ryschka, IEEE Sensors Journal, 21, 3, 2021; DOI: 10.1109/JSEN.2020.3022899; [PDF]
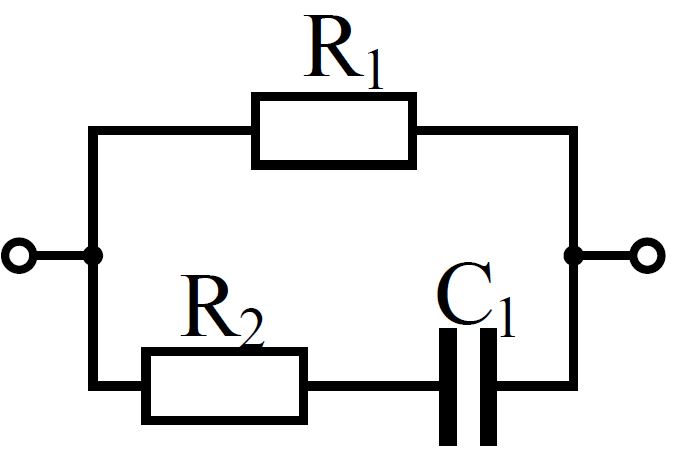
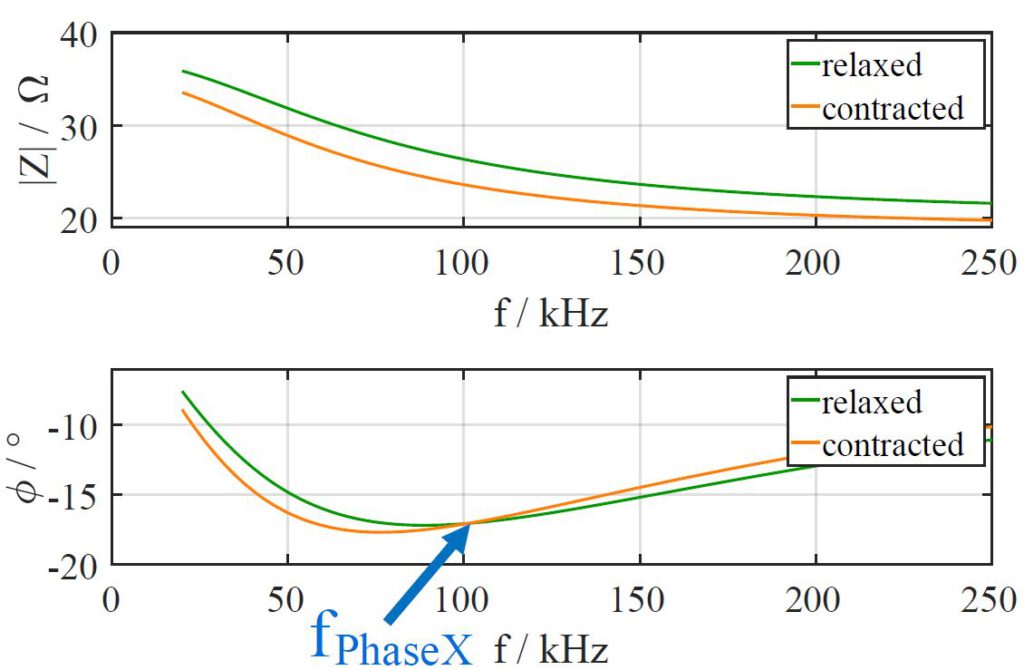
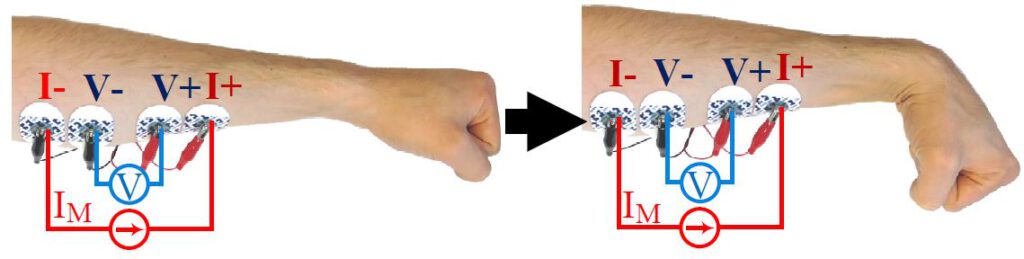
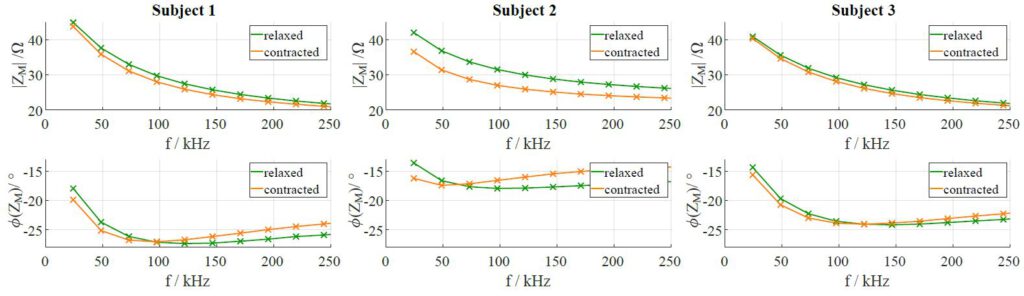
Abstract: Muscle contraction is often detected via EMG in prosthetics. However, signal disturbances due to electrode motions can lead to misinterpretations. Therefore, alternative measurement approaches are desired to increase the reliability of the results. In this work, a novel approach based on impedance myography is proposed. By means of an equivalent circuit of a muscle, its electrical characteristics during contractions are analyzed. In this analysis, a new biomedical marker named the PhaseX Effect is described. This effect is based on the specific behavior of the phase response when the muscle is contracted and is interesting due to its high signal robustness and low signal processing requirements. The resilience of this effect against electrode motion is also analyzed. Measurements of the complex impedance myography spectra are performed on the forearms of three subjects during relaxation and contraction of the corresponding muscle. The subject measurements show the expected behavior of the muscle model. Actual muscle contractions can easily be detected via a simple analysis of the phase response. For a better visualization, the measurements are repeated while acquiring a synchronized video of the moving forearm. The particular effect of the phase response during muscle contraction can be used as a new marker that can be beneficial in several applications such as prostheses control. The PhaseX Effect has high reliability and low signal processing requirements, making it advantageous over other muscle activity markers. The combination of a reliable marker and simple signal analysis promises to become a new method for prostheses control.