Abstract: Muscle contractions are commonly detected by performing EMG measurements. The major disadvantage of this technique is that mechanical disturbances to the electrodes are in the same frequency and magnitude range as the desired signal. In this work we propose an approach and a realized measurement system to combine EMG and bioimpedance measurements for higher reliabilities of muscle contraction detections. Methods: We propose the development of a modular four-channel measurement system, whereat each channel is capable of acquiring EMG, the bioimpedance magnitude and phase, simultaneously. The modules are synchronized by an additional interface board, which communicates with a PC. A graphical user interface enables to control the bioimpedance excitation current in a range from 100 μA to 1 mA in a frequency range from 50 kHz to 333 kHz. Results: A system characterization demonstrated that bioimpedance magnitude changes of less than 250 ppm and phase changes below 0.05° can be detected reliably. Measurements from a subject have shown the timing relationship between EMG and bioimpedance signals as well as their robustness against mechanical disturbances. A measurement of five exemplary hand gestures has demonstrated the increase of usable information for detecting muscle contractions. Conclusion: Bioimpedance measurements of muscles provide useful information about contractions. Furthermore, the usage of a known high-frequency excitation current enables a reliable differentiation between the actual information and disturbances. Significance: By combining EMG and bioimpedance measurements, muscle contractions can be detected much more reliably. This setup can be adopted to prostheses and many other human-computer interfaces.
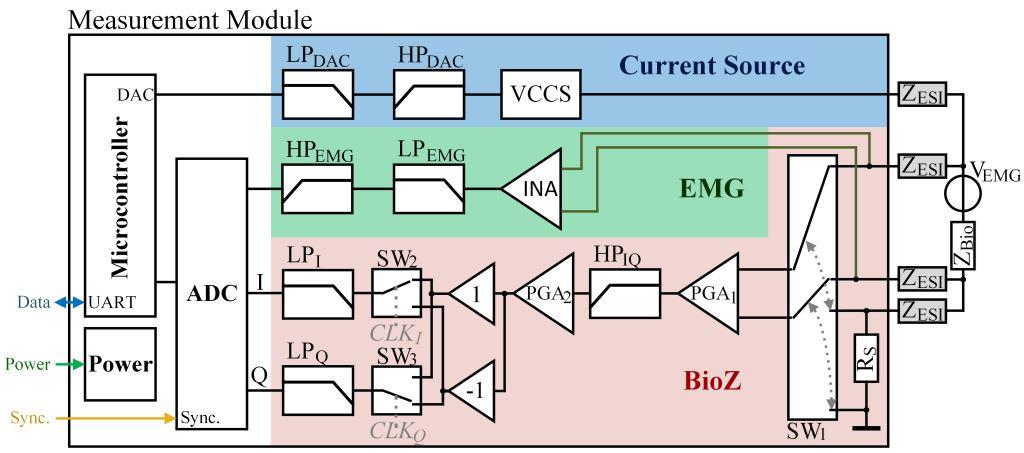
Figure 1: Detailed block diagram of a measurement module. On the left side there are the connections to the previously described interface board. On the right side the connected measurement subject, which is connected via electrodes, is drawn. The measurement module consists of a microcontroller, a power section, an analog-to-digital converter and three major analog electronics blocks. The blue block marks the current source circuit, the green rectangle illustrates the EMG circuit and the red area indicates the bioimpedance measurement circuit, which is based on an IQ-demodulation.
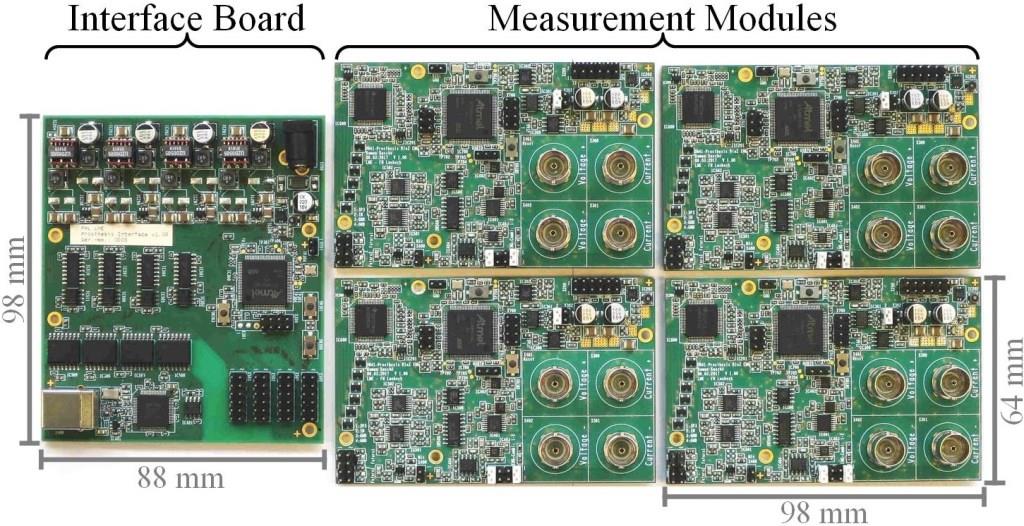
Figure 2: Photograph of the interface board and four measurement modules. The interface board consists of about 200 components and has dimensions of 98 x 88 mm². On the measurement modules about 300 components are populated and its dimensions are 98 x 64 mm².
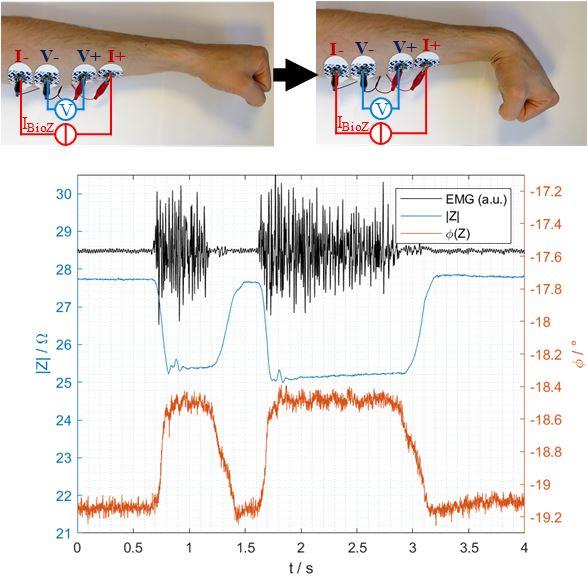
Figure 3: Measurement setup to acquire the muscle contraction during wrist flexions and a plot of the measured raw data of the EMG signal and the complex bioimpedance. The muscle contraction was performed two times. In comparison to the EMG signal, it can be seen, that especially the beginning of the contraction can also easily be detected by performing bioimpedance measurements.
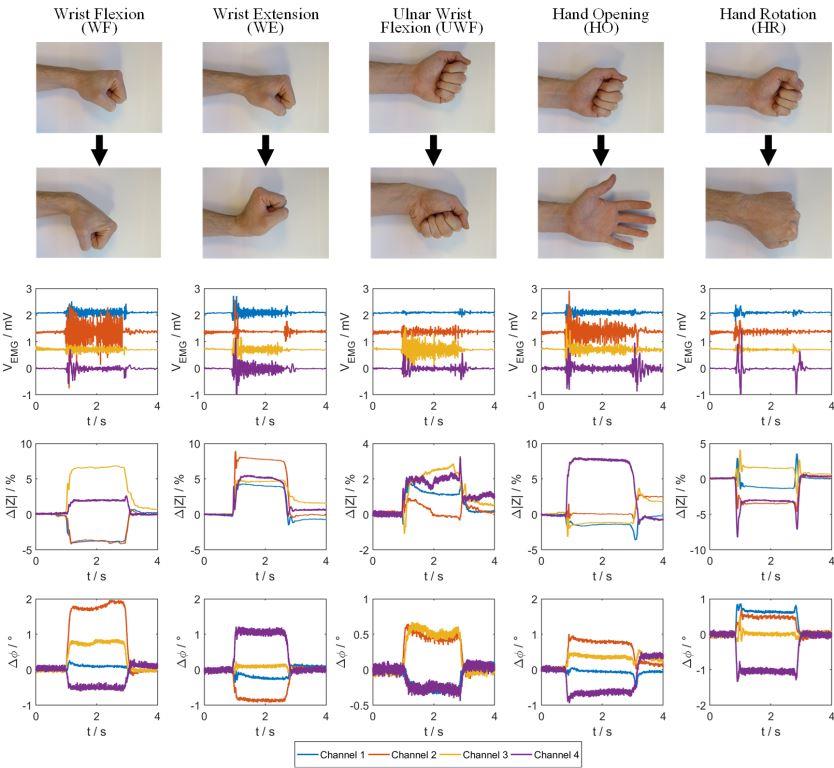
Figure 4: Measurement result of five typical hand gestures, using the four measurement modules simultaneously. Each muscle contraction was performed for a duration of about 2 s. In the plots below the corresponding photographs, the EMG signals as well as the bioimpedance magnitudes and phases are shown. The EMG data was preprocessed by a digital 50 Hz notch filter, whereas the impedance signals have not been filtered digitally. Comparing the resulting plots leads to the conclusion that the magnitude and phase signals of the bioimpedance provide additional useful information about muscle contractions. Additionally, hand gestures which are difficult to detect via EMG measurements, for example the hand rotation (HR), can be recognized via bioimpedance measurements reliably.