R. Kusche, A.-V. Lindenberg, S. Hauschild, and M. Ryschka, IEEE Trans. Biomed. Eng., 66, 11, 2019; DOI:10.1109/TBME.2019.2902721; [PDF]
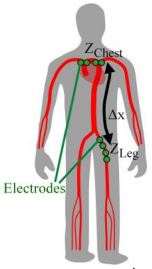
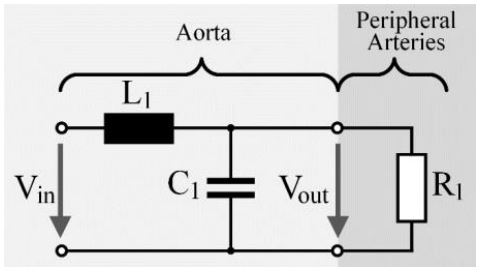
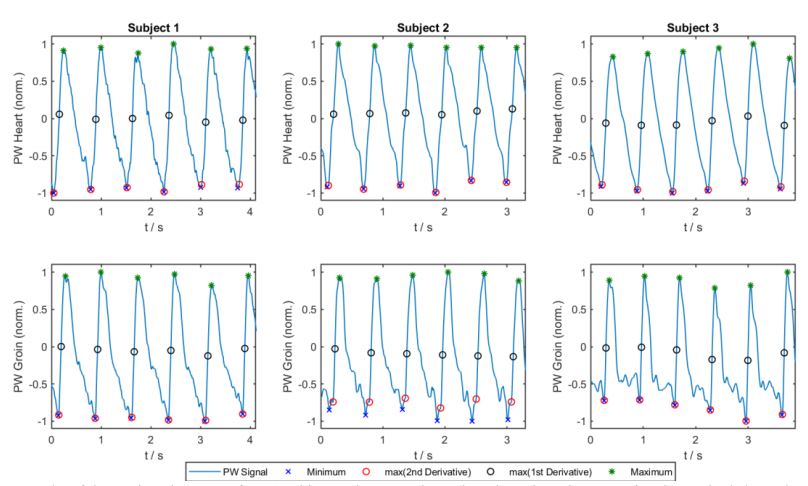
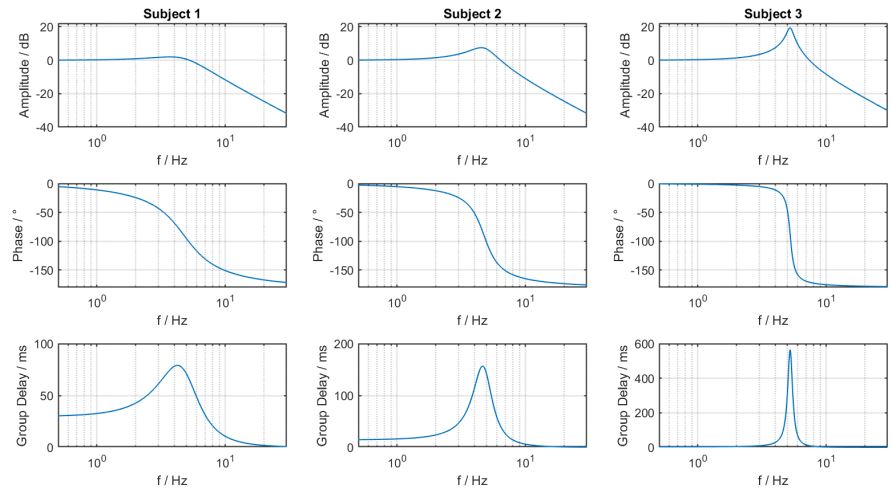
Abstract: Objective: Arterial stiffness is an important marker to predict cardiovascular events. Common measurement techniques to determine the condition of the aorta are limited to the acquisition of the arterial pulse wave at the extremities. The goal of this paper is to enable non-invasive measurements of the aortic pulse wave velocity, instead. An additional aim is to extract further information, related to the conditions of the aorta, from the pulse wave signal instead of only its velocity. Methods: After discussing the problems of common pulse wave analysis procedures, an approach to determine the frequency response of the aorta is presented. Therefore, the aorta is modeled as an electrical equivalent circuit. To determine the specific numeric values of this system, a measurement approach is presented, which is based on non-invasive bioimpedance plethysmography measurements above the aortic arch and at the inguinal region. The conversion of the measurement results to the system parameters is realized by a digital algorithm, which is proposed in this paper as well. To evaluate the approach, a study on three subjects is performed. Results: The measurement results demonstrate that the proposed approach yields realistic frequency responses. For better approximation of the aortic system function, more complex models are recommended to investigate in the future. Since this paper is limited to three subjects without a ground truth, further measurements will be necessary. Significance: The proposed approach could solve the problems of current methods to determine the condition of the aorta. Its application is non-invasive, harmless, and easy to execute.